In this lecture, we will show you how to group (and ungroup) rows and columns
When rows or columns are grouped, expandable and collapsible tabs are created, which allow you to quickly hide and unhide data
Moreover, Excel enables you to create sub-groups of rows and columns within groups (as you will see below)
Conversely, ungrouping allows you to undo any groupings previously created
Note that Microsoft uses the term "outline" in place of "group" when referring to this functionality (as per the link at the end of the lecture)
This term makes sense, since this functionality effectively allows you to create logical outlines of data
Buttons
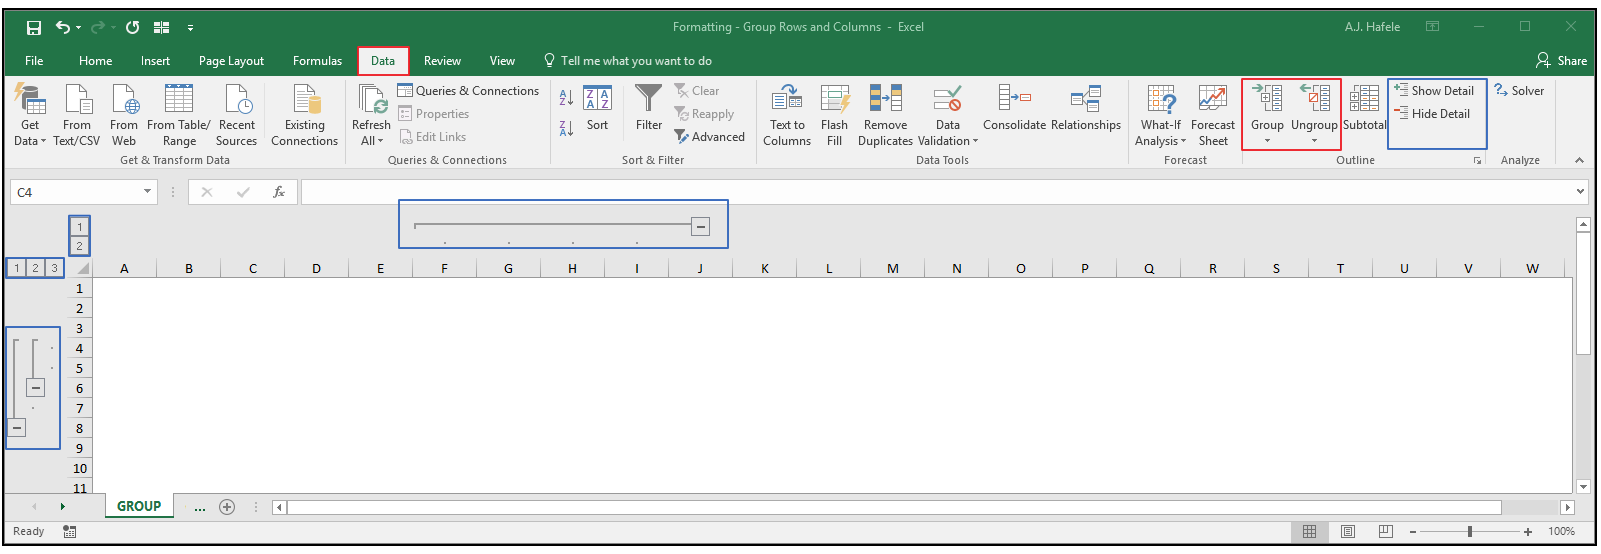
The relevant buttons can be found in the Outline group of the Data tab:
Note that the items boxed in blue above are only available when grouped rows or columns exist in the worksheet
We will illustrate how to use these buttons in the below discussion
Group Rows and Columns
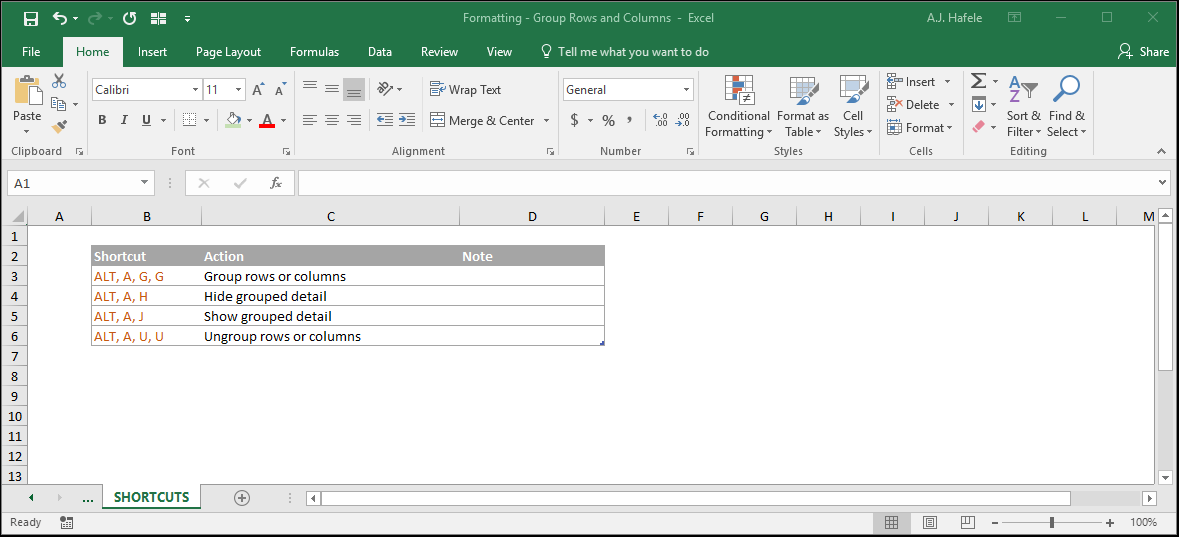
The following illustrates how to group rows and columns (ALT, A, G, G):
Notice that:
The Group button in the Ribbon will group both rows and columns
After grouping, you now can quickly toggle between hiding and unhiding rows and columns
You can toggle using either the "+/-" buttons or the numerical outline symbols (just below the name box)
Clicking the "1" outline button will collapse rows and columns, and clicking the "2" button will expand rows and columns
The presence of the "+/-" and numerical outline symbols indicates that you have hidden data, thereby reducing the chances of forgetting that data are hidden
Though not shown above, you cannot group non-contiguous ranges
Sub-Groups
In addition, you have the ability to create subgroups within already-grouped rows and columns
The next example illustrates how to create sub-groups (ALT, A, G, G) (pay close attention to the group spacing):
Notice that there are now three numerical outline buttons below the name box
Clicking "3" shows all rows of data; clicking "2" collapses the sub-groupings, and clicking "1" collapses all groupings (in a hierarchical manner)
Excel enables a maximum of 8 levels of groupings
When creating sub-groups, it is important to be aware of the spacing between groupings
At the end of the above illustration, if we were to group row 17, the bottom two sub-groups would have combined into a single large sub-group, capturing rows 14 through 20, which is not desirable, as shown here:
After we grouped row 17, Sub-Account 3 and Sub-Account 4 data are now in one big, ugly group, which makes our group (or outline) structure inconsistent
As a final note on sub-groups, please keep in mind that the above examples are used only to illustrate how to create sub-groups; this is not the best way to approach handling this type of data
In this case, it is much easier to use a single table (with no groupings) with a PivotTable, or to use Subtotals
We sill discuss these functionalities later on in those lectures (no need to skip to those lectures at this point)
Ungroup Rows and Columns
The next example illustrates how to ungroup rows and columns (ALT, A, U, U):
Notice that ungrouping rows and columns will remove the toggle / outline buttons, bringing us back to where we initially were
Though not shown above, you cannot ungroup non-contiguous ranges
Tips
To reiterate once more, do not hide rows and columns - group them instead!
Take advantage of sub-groups where necessary, but avoid over-complicating things
Using groupings can be helpful in hiding columns of data (that you do not need to immediately view) in wide tables, as shown here (we use ALT, A, H at the end to quickly hide detail):
Using groupings can also be helpful in worksheets that contain textual data, such as instructions, which are in some type of hierarchical order (such as instructions with sub-steps)