Subtotals allow you to group and summarize a tabular range of data in a user-defined manner (utilizing the SUBTOTAL function)
Subtotals cannot work on data contained in tables
Moreover, subtotals are less flexible than PivotTables (discussed at the end of this section)
Nevertheless, some people may find the subtotal functionality useful and easier to manage
Buttons
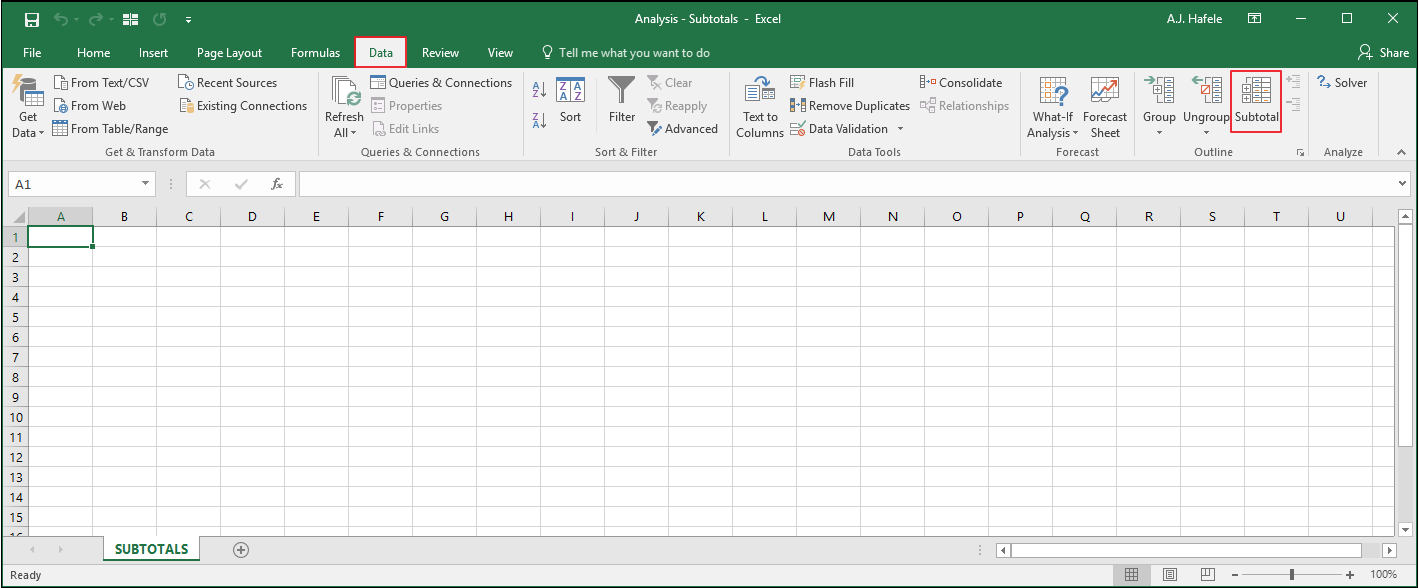
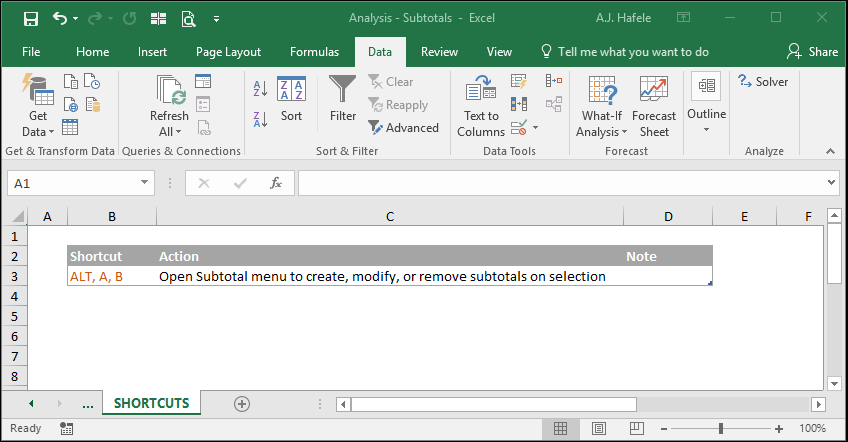
The relevant button can be found in the Outline group of the Data tab:
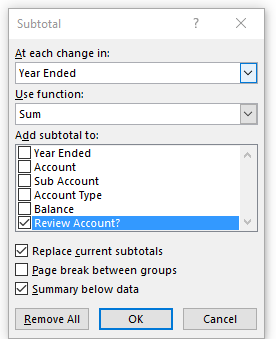
When that button is clicked, the following Subtotal menu appears:
We will discuss how this menu works in the sections below
Examples
Before creating subtotals, we must first sort the table in a manner consistent with how we ultimately want to see the data.
In this example, we want to subtotal primarily by Account, but we also want to keep the Sub Accounts sorted from smallest to largest, so let's do that:
Notice above that we were able to create a subtotal by clicking anywhere in the range of data, and then pressing the Subtotal button
As with sorting and filtering, however, it is wise to manually select the entire range of data before using the subtotal functionality, to ensure all data are captured
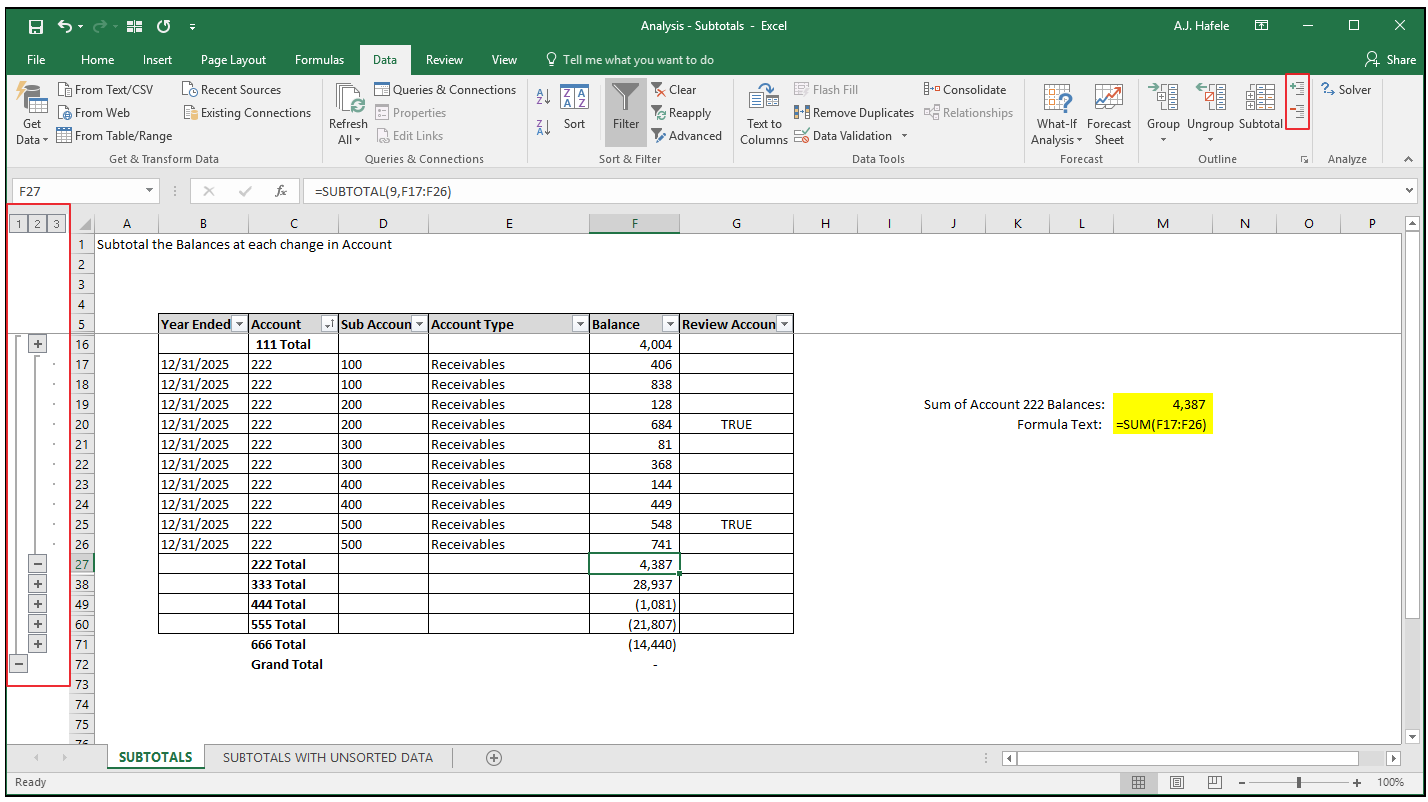
Here is a screenshot of the resulting subtotal, with the details for Account 222 ungrouped (the buttons boxed in red allow you to group and ungroup):
Notice that:
The bolded rows (rows 16, 27, 38, 49, etc.) contain subtotals for each Account
The function in column F for those bolded rows is SUBTOTAL (with the first argument being 9, corresponding to SUM) - see the formula bar in the screenshot for cell F27
The subtotals are organized first by Account, and then by Sub Account (see the organization for Account 222 above). This only happened because we manually sorted the data before creating the subtotal
Minor side note (in case you were curious): rows 71 and 72 do not have borders simply because I did not format those rows with borders before performing the subtotal
Observe what happens if the data are not sorted before creating the subtotal (the table below is sorted by Balance):
The subtotal was created, but since the data were not sorted by Account / Sub Account, the subtotals are messy - there are multiple subtotals for the same Account! Thus, the subtotal is useless
Continuing with the first example, let's perform another subtotal by Account, but let's compute the average of the Balances in each account:
Notice that:
We started from an already-subtotaled range of data
Since we are effectively re-doing the subtotal, all we needed to do is ensure the "Replace current subtotals" box within the Subtotal menu is checked
The SUBTOTAL functions are now performing an AVERAGE (the first argument of the SUBTOTAL function being 1 instead of 9)
Note that the "Summary below data" box simply adds a grand total (or average, count, etc.) at the very bottom of the data range
Let's subtotal using SUM again, but this time unchecking "Summary below data":
The result is that the summary row is moved to the very top!
What happens if we try to sort the range that is subtotaled? Let's see:
Here is a screenshot of that pop-up menu, for reference:
As you can see, the subtotals are completely removed if you sort and then click "Yes" on the pop-up message
Finally, let's completely remove the subtotal via the Subtotal menu instead: