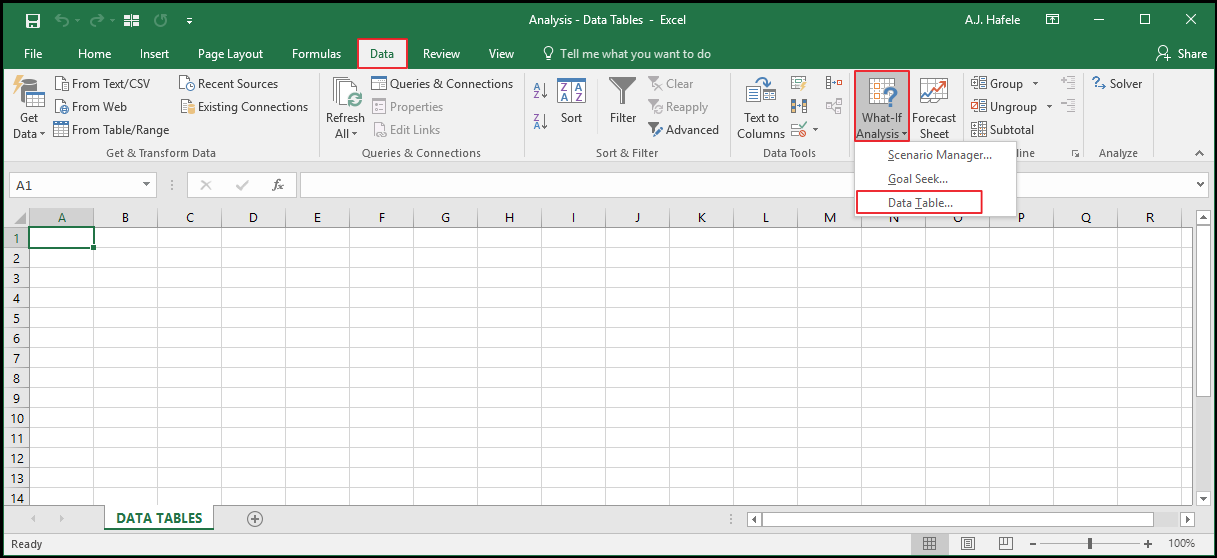
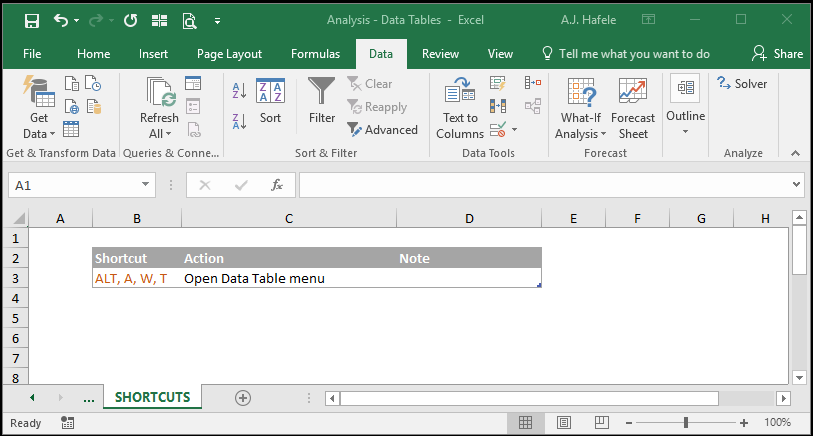
The relevant button can be found in the Forecast group of the Data tab:
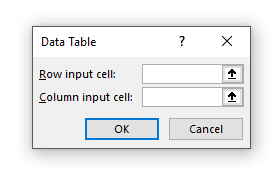
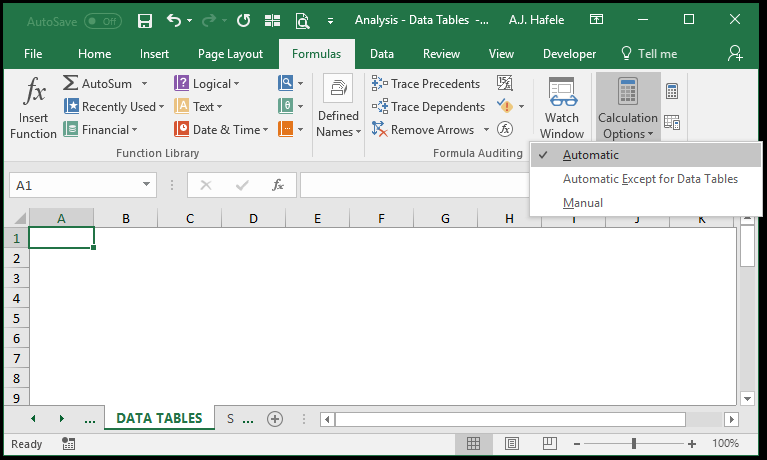
When the Data Table... button is selected, the following menu appears:
We will discuss how to use this menu below
Data Tables Explained
As indicated above, data tables allow you to perform sensitivity analyses on a user-defined output (calculation), by changing either one or two variables
One-variable data tables allow you to analyze an output by changing one variable
For example, you can see how your monthly loan payment (output) will change when the interest rate (variable) changes
One-variable data tables have either a single row or single column of output data (as you will see below)
Two-variable data tables allow you to analyze an output by changing two variables
For example, you can see how your monthly loan payment (output) will change when the interest rate (1st variable) and loan amount (2nd variable) changes
Two-variable data tables present output in multiple rows and columns (i.e. a grid of output, as you will see below)
Example - One-Variable Data Table
To demonstrate how to create a one-variable data table:
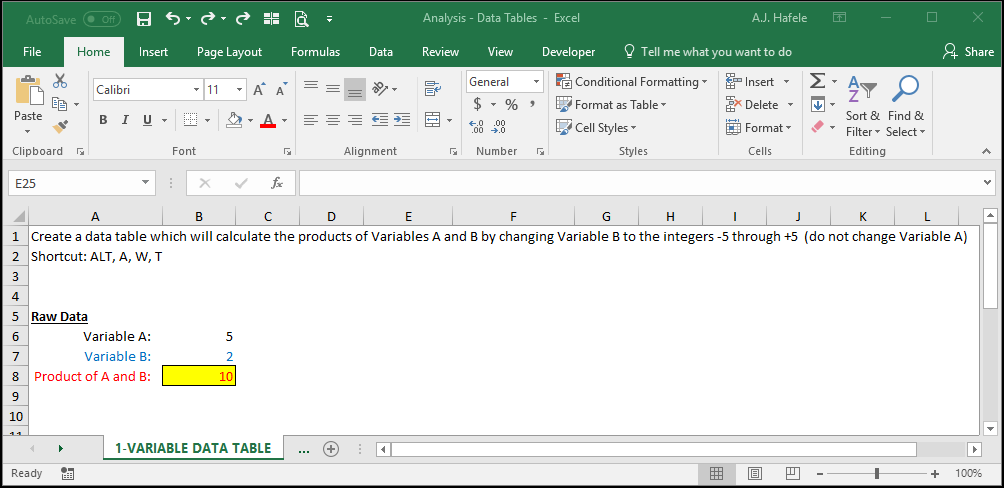
Let's simply multiply two numbers - Variable A and Variable B - to return an output
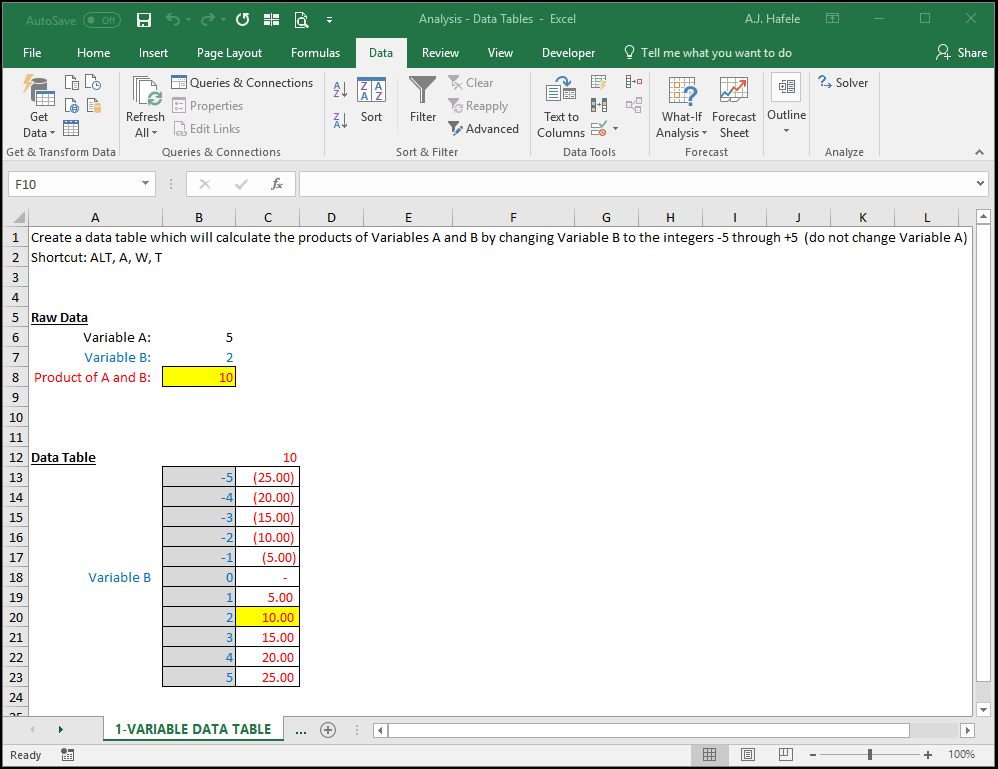
Let's see how the output changes if we modify Variable B but leave Variable A unchanged (at 5)
Here is a screenshot of our initial setup:
Note that:
Variable B is color-code blue
The output (A multiplied by B) is color-coded red
All yellow highlights should contain the same output, as you will see at the end of the example
This color coding applies throughout the lecture, to help you see how to set up your data table
Now, let's create a data table which will present the output (the product of A and B), assuming that Variable B (only) is changed:
Here is a screenshot, for reference:
Notice that:
Since we want to change Variable B, we placed -5 through +5 in the row headers (in grey)
Since the grey row headers are in a column, we only fill in the "Column input cell" input in the Data Table menu. Behind the scenes, Excel will use the numbers in the grey cells as Variable B, and return the recalculated output
Importantly, we hard-coded these numbers! If you do not hard-code these numbers, your data table may return errors!
The row and column input cells can be flipped (and the same result will occur)
We linked the output calculation in cell B8 to the cell directly above the output of our data table - this is also a must-do!
Alternatively, we could have cut and pasted the output calculation contained in cell B8 directly above our output (in cell C12)
The resulting output shows how the product of Variable A (the number 5) and B will change, upon changing Variable B
As you can see, the two yellow highlights are now the same, which helps us validate that the data table is working correctly!
To delete the output data table, you must select and delete the entire output range at once, as shown here (you can also press DELETE or ALT, H, E, C upon selecting the entire range):
Example - Two-Variable Data Table
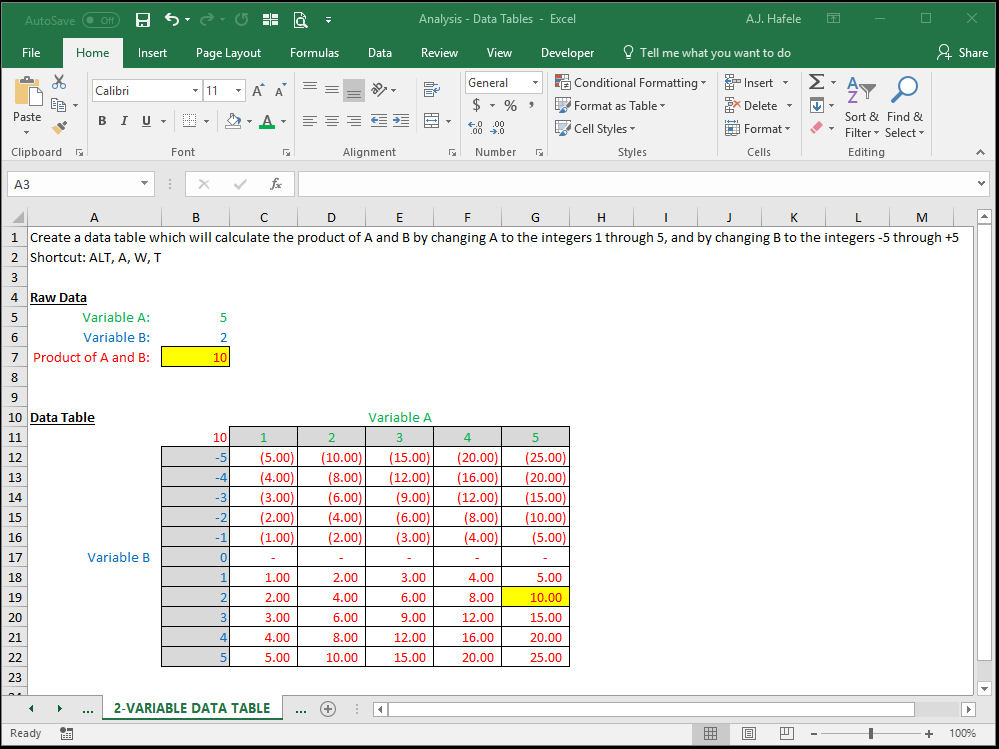
Building on the example above, let's now create a two-variable data table
This time, let's see what happens to the output when both Variable A (color-coded green) and Variable B change
Since we are analyzing the output as two variables change, we will have a grid of data
Since the setup is the same as the previous example, let's jump straight to a screenshot:
Notice that:
Again, we hard-coded the row and column header numbers (grey cells)
The link to the output calculation (in B7 this time) is now at the top-left corner of the data table (not directly above any output, as with the one-variable data table)
The resulting output shows how the product of Variable A and B will change, upon changing both Variable A and Variable B (thus, this is effectively a multiplication table, as the underlying calculation is just the product of 2 numbers)
As you can see, the two yellow highlights are now the same, which helps us validate that the data table is working correctly!
Let's delete the data again, by selecting and deleting the entire output (we will use ALT, H, E, C this time):
Calculation Option - Automatic Except for Data Tables
Let's briefly continue our discussion on Excel's calculation options as they pertain to data tables
As shown here, there are three different calculation options to choose from in Excel, one of which is Automatic Except for Data Tables:
The Automatic Except for Data Tables option is exactly the same as Automatic, except you must manually calculate your worksheet or workbook in order to update your data tables
In the next illustration, observe that:
The data table output will change instantly the first time we update a variable (under the Automatic calculation option)
After setting the calculation option to Automatic Except for Data Tables, the data table will not automatically refresh until we click Calculate Sheet:
But why ever use the Automatic Except for Data Tables calculation option?
When more complex calculations need to be made within data tables, Excel can take much longer to refresh those values (sometimes 10+ seconds for each refresh)
This can be really annoying when modifying data in your files
As such, this option allows your workbook to update data tables only when you manually refresh your workbook or worksheet
If you use this calculation option, be sure to refresh before analyzing your data tables when this option is selected!
Tips
The above examples were extremely simple (on purpose), in order to illustrate how data tables work
But data tables can handle much more sophisticated calculations that would otherwise be difficult to examine using formulas alone
Data tables can work well with charts in order to better-visualize an output's sensitivity to a variable